

This week, we are releasing another exciting analytics capability for you – Path Metrics
Path Metrics Release
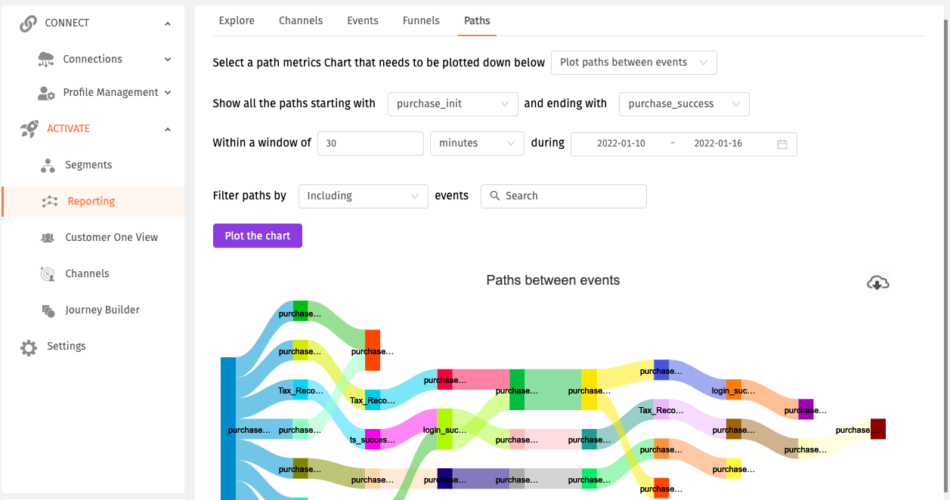
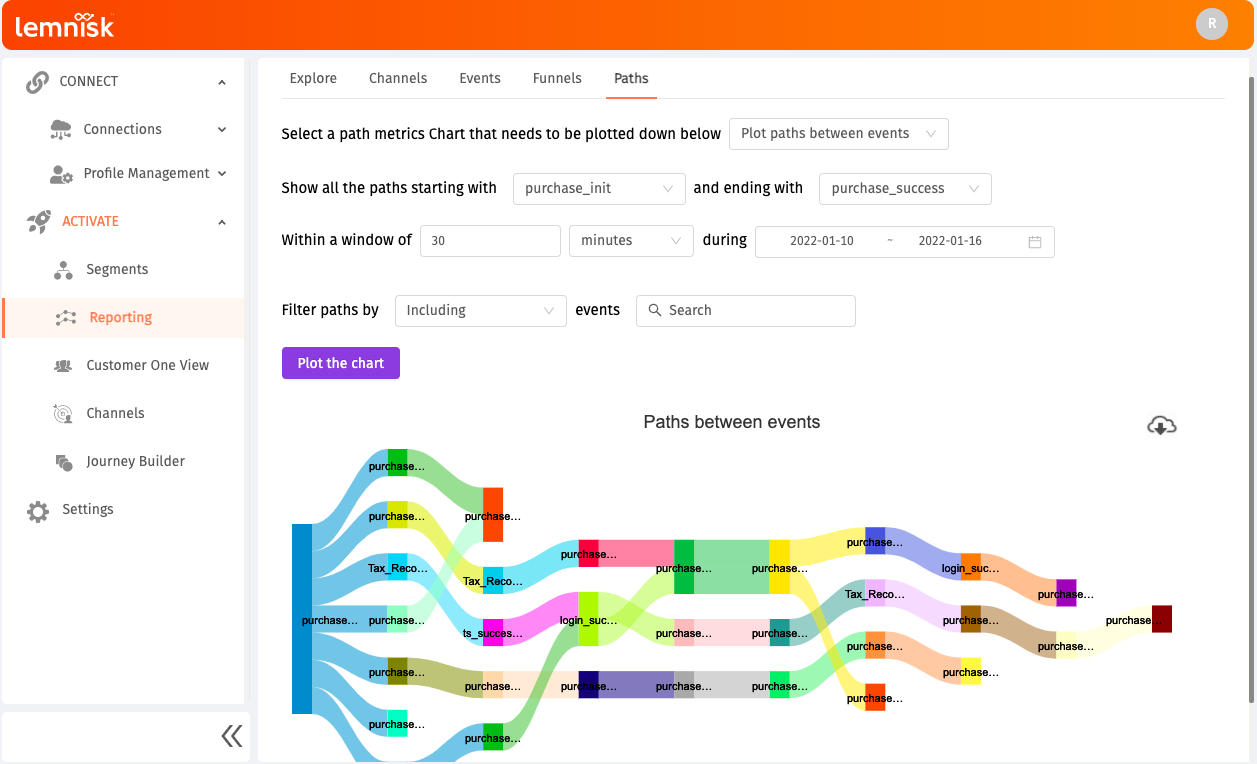
Path Metrics, a powerful visual analytics report on top of the Lemnisk CDP that gives you unparalleled insight into key customer journeys. Simply pick CDP events for a timeframe and you can observe every possible “flow” path that users have taken between these events. The thicker the “flow”, the more users who are in that path and vice versa.
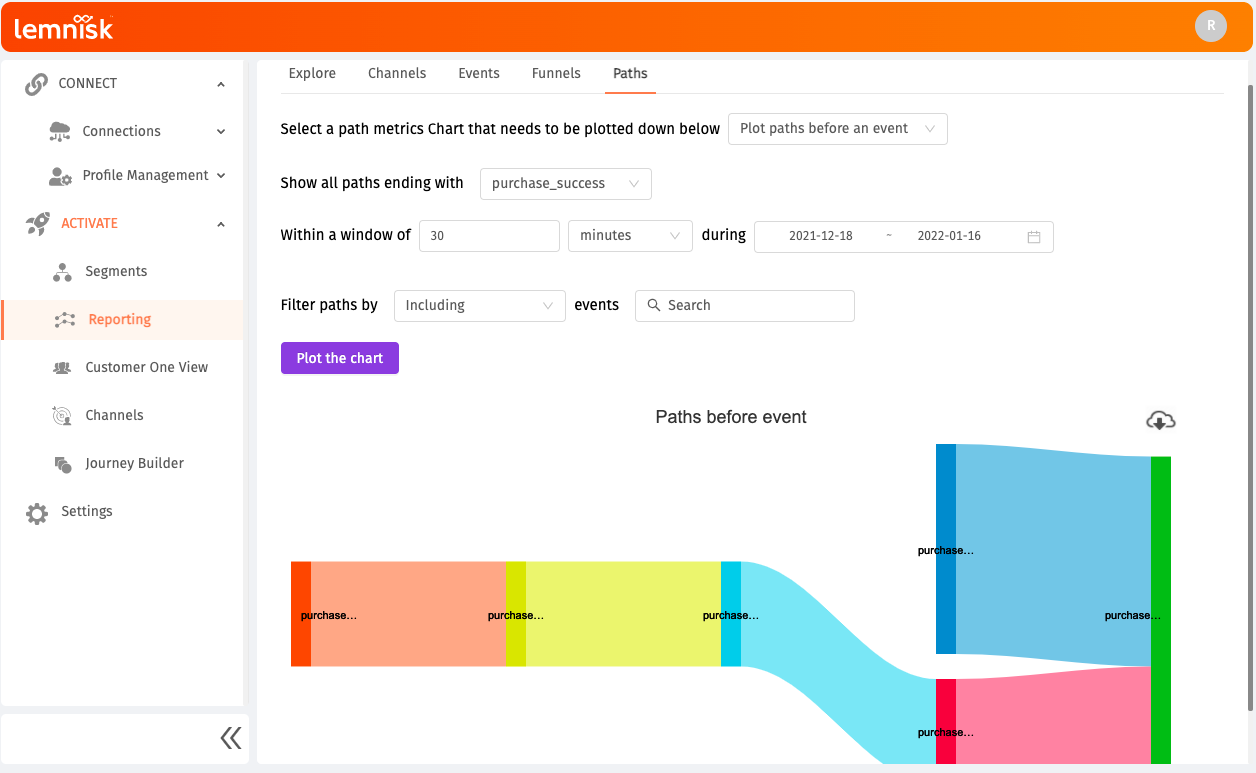
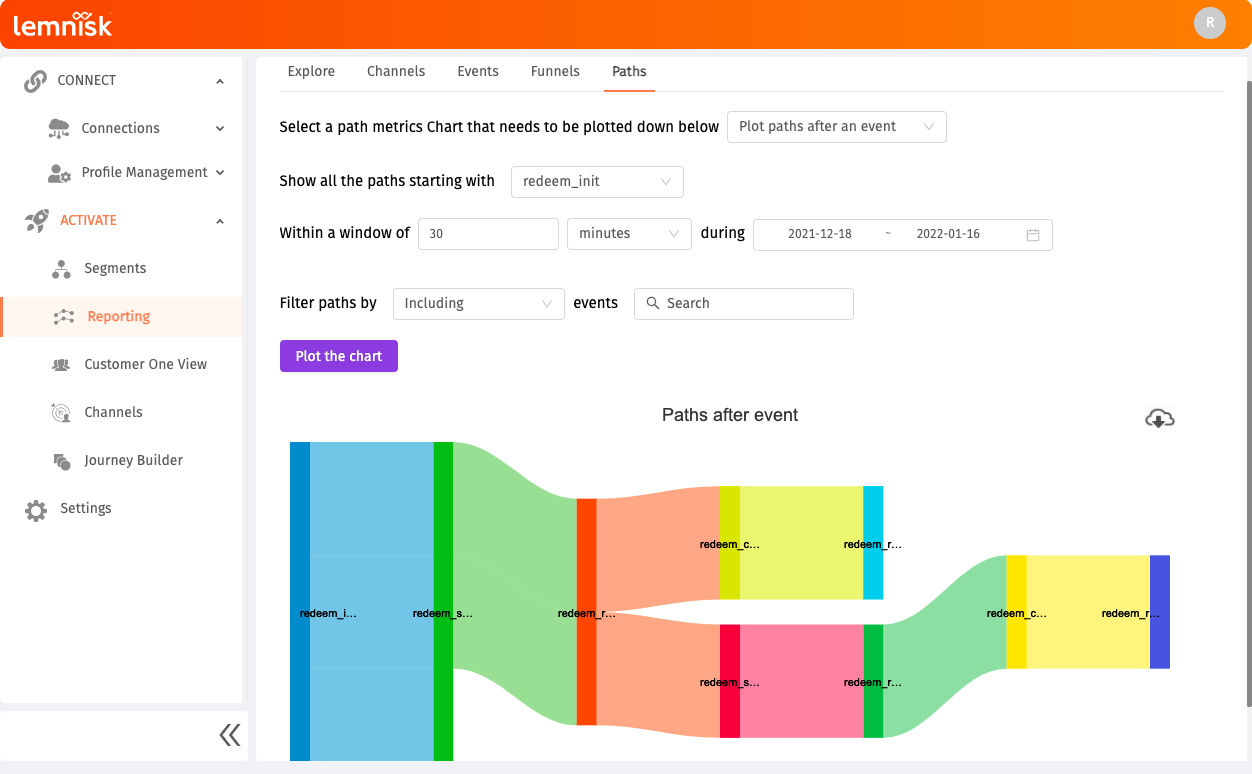
You can also run two other types of analysis:
- Before event: Where you pick a single event and look at all possible path flows leading up to the event
- After event: Where you pick a single event and look at all possible path flows after that event
These analyses are useful to understand how your users are navigating customer journeys. You may have an “ideal flow” in mind between two events, or after or leading up to an event. E.g. between home page visit and lead page, leading up to conversion event, or after a product page visit. But users may take many additional paths. Or may drop off at different stages.
In one single visual, path metrics help you understand the most important journeys your customers are undertaking. Once you have this insight, you can take many different actions as marketers.
- Deep dive into the reason users are dropping off at a particular path
- Craft nudges to move users away from sub-optimal paths into smoother ones
Do remember, leveraging this feature requires you to be on Lemnisk’s event-based framework. In case you missed this update that we sent, here’s a refresher.
Please contact your Customer Success or Delivery partner if you are not on the event-based framework yet. Or if you want to understand Path Metrics in more detail.
Keep watching this space for more exciting features coming your way.
By Bijoy K.B | Senior Marketing Manager at Lemnisk
Source link