


A/B testing splits traffic 50/50 between a control and a variation. A/B split testing is a new term for an old technique—controlled experimentation.
Yet for all the content out there about it, people still test the wrong things and run A/B tests incorrectly.
This guide will help you understand everything you need to get started with A/B testing. You’ll see the best ways to run tests, prioritize hypotheses, analyze results, and the best tools to experiment through A/B testing.
What is A/B testing?
A/B testing is a experimentation process where two or more variants (A and B) are compared, in order to determine which variable is more effective.
When researchers test the efficacy of new drugs, they use a “split test.” In fact, most research experiments could be considered a “split test,” complete with a hypothesis, a control, a variation, and a statistically calculated result.
That’s it. For example, if you ran a simple A/B test, it would be a 50/50 traffic split between the original page and a variation:
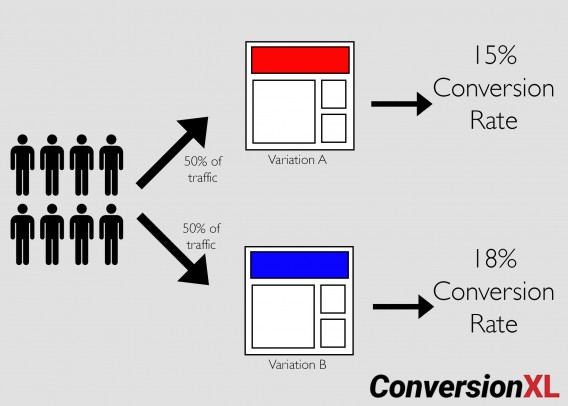 A/B testing splits traffic 50/50 between a control and a variation.
For conversion optimization, the main difference is the variability of Internet traffic. In a lab, it’s easier to control for external variables. Online, you can mitigate them, but it’s difficult to create a purely controlled test.
In addition, testing new drugs requires an almost certain degree of accuracy. Lives are on the line. In technical terms, your period of “exploration” can be much longer, as you want to be damn sure that you don’t commit a Type I error (false positive).
Online, the process for A/B split-testing considers business goals. It weighs risk vs. reward, exploration vs. exploitation, science vs. business. Therefore, we view results through a different lens and make decisions differently than those running tests in a lab.
You can, of course, create more than two variations. Tests with more than two variations are known as A/B/n tests. If you have enough traffic, you can test as many variations as you like. Here’s an example of an A/B/C/D test, and how much traffic each variation is allocated:
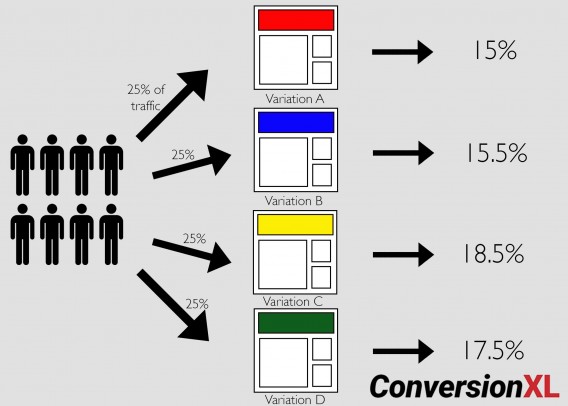 An A/B/n test splits traffic equally among a control and multiple page variations.
A/B/n tests are great for implementing more variations of the same hypothesis, but they require more traffic because they split it among more pages.
A/B tests, while the most popular, are just one type of online experiment. You can also run multivariate and bandit tests.
A/B Testing, multivariate testing, and bandit algorithms: What’s the Difference?
A/B/n tests are controlled experiments that run one or more variations against the original page. Results compare conversion rates among the variations based on a single change.
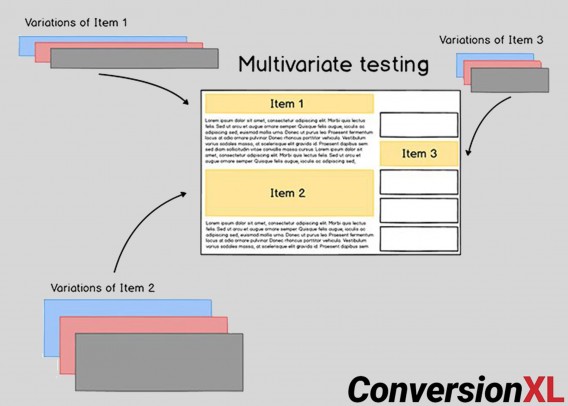
Multivariate tests test multiple versions of a page to isolate which attributes cause the largest impact. In other words, multivariate tests are like A/B/n tests in that they test an original against variations, but each variation contains different design elements. For example:
Each element has a specific impact and use case to help you get the most out of your site. Here’s how:
- Use A/B testing to determine the best layouts.
- Use multivariate tests to polish layouts and ensure all elements interact well together.
You need to a ton of traffic to the page you’re testing before even considering multivariate testing. But if you have enough traffic, you should use both types of tests in your optimization program.
Most agencies prioritize A/B testing because you’re usually testing more significant changes (with bigger potential impacts), and because they’re simpler to run. As Peep once said, “Most top agencies that I’ve talked to about this run ~10 A/B tests for every 1 MVT.”
Bandit algorithms are A/B/n tests that update in real time based on the performance of each variation.
In essence, a bandit algorithm starts by sending traffic to two (or more) pages: the original and the variation(s). Then, to “pull the winning slot machine arm more often,” the algorithm updates based on which variation is “winning.” Eventually, the algorithm fully exploits the best option:
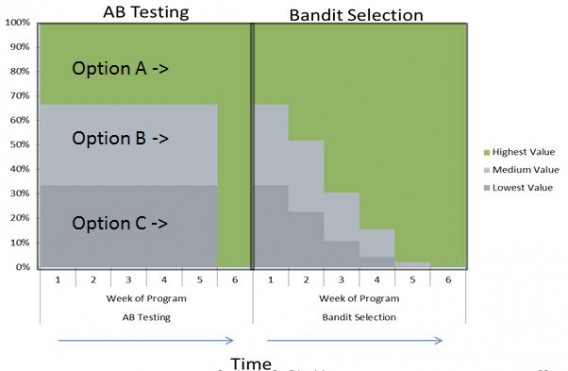
One benefit of bandit testing is that bandits mitigate “regret,” which is the lost conversion opportunity you experience while testing a potentially worse variation. This chart from Google explains that very well:
Bandits and A/B/n tests each have a purpose. In general, bandits are great for:
- Headlines and short-term campaigns;
- Automation for scale;
- Targeting;
- Blending optimization with attribution.
No matter what type of test you run, it’s important to have a process that improves your chances of success. This means running more tests, winning more tests, and making bigger lifts.
How to improve A/B test results
Ignore blog posts that tell you “99 Things You Can A/B Test Right Now.” They’re a waste of time and traffic. A process will make you more money.
Some 74% of optimizers with a structured approach to conversion also claim improved sales. Those without a structured approach stay in what Craig Sullivan calls the “Trough of Disillusionment.” (Unless their results are littered with false positives, which we’ll get into later.)
To simplify a winning process, the structure goes something like this:
- Research;
- Prioritization;
- Experimentation;
- Analyze, learn, repeat.
Research: Getting data-driven insights
To begin optimization, you need to know what your users are doing and why.
Before you think about optimization and testing, however, solidify your high-level strategy and move down from there. So, think in this order:
- Define your business objectives.
- Define your website goals.
- Define your Key Performance Indicators.
- Define your target metrics.
Once you know where you want to go, you can collect the data necessary to get there. To do this, we recommend the ResearchXL Framework.
Here’s the executive summary of the process we use at CXL:
- Heuristic analysis;
- Technical analysis;
- Web analytics analysis;
- Mouse-tracking analysis;
- Qualitative surveys;
- User testing and copy testing.
Heuristic analysis is about as close as we get to “best practices.” Even after years of experience, you still can’t tell exactly what will work. But you can identify opportunity areas. As Craig Sullivan puts it:
My experience in observing and fixing things: These patterns do make me a better diagnostician, but they don’t function as truths—they guide and inform my work, but they don’t provide guarantees.
Craig Sullivan
Humility is crucial. It also helps to have a framework. When doing heuristic analysis, we assess each page based on the following:
- Relevancy;
- Clarity;
- Value;
- Friction;
- Distraction.
Technical analysis is an often-overlooked area. Bugs—if they’re around—are a conversion killer. You may think your site works perfectly in terms of user experience and functionality. But does it work equally well with every browser and device? Probably not.
This is a low-hanging—and highly profitable—fruit. So, start by:
- Conducting cross-browser and cross-device testing.
- Doing a speed analysis.
Web analytics analysis is next. First thing’s first: Make sure everything is working. (You’d be surprised by how many analytics setups are broken.)
Google Analytics (and other analytics setups) are a course in themselves, so I’ll leave you with some helpful links:
- Google Analytics 101: How to Set Up Google Analytics;
- Google Analytics 102: How To Set Up Goals, Segments & Events in Google Analytics.
Next is mouse-tracking analysis, which includes heat maps, scroll maps, click maps, form analytics, and user session replays. Don’t get carried away with pretty visualizations of click maps. Make sure you’re informing your larger goals with this step.
Qualitative research tells you the why that quantitative analysis misses. Many people think that qualitative analysis is “softer” or easier than quantitative, but it should be just as rigorous and can provide insights as important as those from analytics.
For qualitative research, use things like:
- On-site surveys;
- Customer surveys;
- Customer interviews and focus groups.
Finally there’s user testing. The premise is simple: Observe how actual people use and interact with your website while they narrate their thought process aloud. Pay attention to what they say and what they experience.
With copy testing, you learn how your actual target audience perceives the copy, what clear or unclear, what arguments they care about or not.
After thorough conversion research, you’ll have lots of data. The next step is to prioritize that data for testing.
How to prioritize A/B test hypotheses
There are many frameworks to prioritize your A/B tests, and you could even innovate with your own formula. Here’s a way to prioritize work shared by Craig Sullivan.
Once you go through all six steps, you will find issues—some severe, some minor. Allocate every finding into one of five buckets:
- Test. This bucket is where you place stuff for testing.
- Instrument. This can involve fixing, adding, or improving tag/event handling in analytics.
- Hypothesize. This is where you’ve found a page, widget, or process that’s not working well but doesn’t reveal a clear solution.
- Just Do It. Here’s the bucket for no-brainers. Just do it.
- Investigate. If an item is in this bucket, you need to ask questions or dig deeper.
Rank each issue from 1 to 5 stars (1 = minor, 5 = critical). There are two criteria that are more important than others when giving a score:
- Ease of implementation (time/complexity/risk). Sometimes, data tells you to build a feature that will take months to develop. Don’t start there.
- Opportunity. Score issues subjectively based on how big a lift or change they may generate.
Create a spreadsheet with all of your data. You’ll have a prioritized testing roadmap.
We created our own prioritization model to weed out subjectivity (as possible). It’s predicated on the need to bring data to the table. It’s called PXL and looks like this:
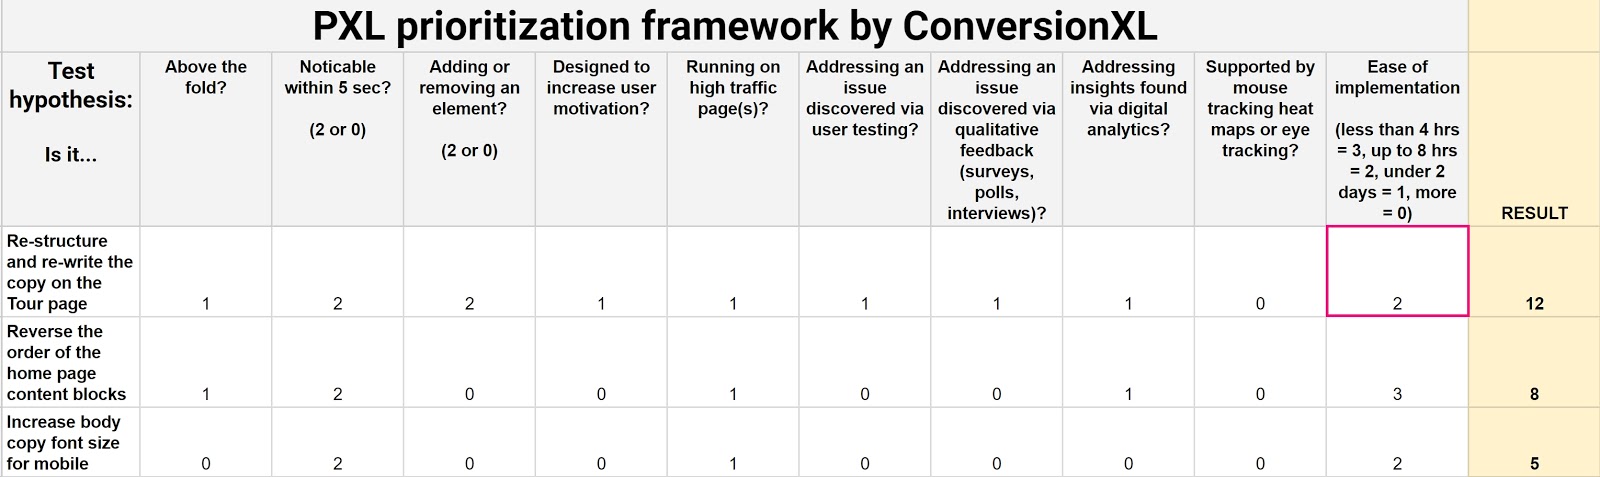
Grab your own copy of this spreadsheet template here. Just click File > Make a Copy to make it your own.
Instead of guessing what the impact might be, this framework asks you a set of questions about it:
- Is the change above the fold? More people notice above-the-fold changes. Thus, those changes are more likely to have an impact.
- Is the change noticeable in under 5 seconds? Show a group of people the control and then the variation(s). Can they tell a difference after 5 seconds? If not, it’s likely to have less of an impact.
- Does it add or remove anything? Bigger changes like removing distractions or adding key information tend to have more of an impact.
- Does the test run on high-traffic pages? An improvement to a high-traffic page generates bigger returns.
Many potential test variables require data to prioritize your hypotheses. Weekly discussions that ask these four questions will help you prioritize testing based on data, not opinions:
- Is it addressing an issue discovered via user testing?
- Is it addressing an issue discovered via qualitative feedback (surveys, polls, interviews)?
- Is the hypothesis supported by mouse tracking, heat maps, or eye tracking?
- Is it addressing insights found via digital analytics?
We also put bounds on Ease of implementation by bracketing answers according to the estimated time. Ideally, a test developer is part of prioritization discussions.
Grading PXL
We assume a binary scale: You have to choose one or the other. So, for most variables (unless otherwise noted), you choose either a 0 or a 1.
But we also want to weight variables based on importance—how noticeable the change is, if something is added/removed, ease of implementation. For these variables, we specifically say how things change. For instance, on the Noticeability of the Change variable, you either mark it a 2 or a 0.
Customizability
We built this model with the belief that you can and should customize variables based on what matters to your business.
For example, maybe you’re working with a branding or user experience team, and hypotheses must conform to brand guidelines. Add it as a variable.
Maybe you’re at a startup whose acquisition engine is fueled by SEO. Maybe your funding depends on that stream of customers. Add a category like, “doesn’t interfere with SEO,” which might alter some headline or copy tests.
All organizations operate under different assumptions. Customizing the template can account for them and optimize your optimization program.
Whichever framework you use, make it systematic and understandable to anyone on the team, as well as stakeholders.
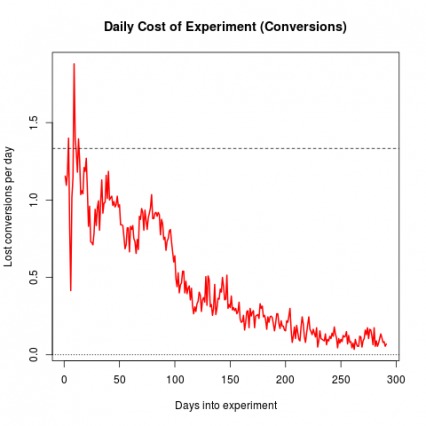
How long to run A/B tests
First rule: Don’t stop a test just because it reaches statistical significance. This is probably the most common error committed by beginner optimizers with good intentions.
If you call tests when you hit significance, you’ll find that most lifts don’t translate to increased revenue (that’s the goal, after all). The “lifts” were, in fact, imaginary.
Consider this: When 1,000 A/A tests (two identical pages) were run:
- 771 experiments out of 1,000 reached 90% significance at some point.
- 531 experiments out of 1,000 reached 95% significance at some point.
Stopping tests at significance risks false positives and excludes external validity threats, like seasonality.
Predetermine a sample size and run the test for full weeks, usually at least two business cycles.
How do you predetermine sample size? There are lots of great tools. Here’s how you’d calculate your sample size with Evan Miller’s tool:
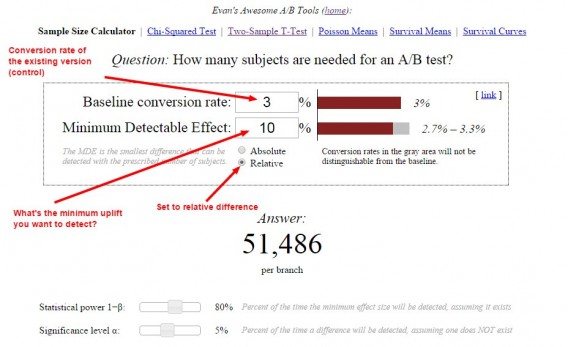
In this example, we told the tool that we have a 3% conversion rate and want to detect at least 10% uplift. The tool tells us that we need 51,486 visitors per variation before we can look at statistical significance levels.
In addition to significance level, there’s something called statistical power. Statistical power attempts to avoid Type II errors (false negatives). In other words, it makes it more likely that you’ll detect an effect if there actually was one.
For practical purposes, know that 80% power is the standard for A/B testing tools. To reach such a level, you need either a large sample size, a large effect size,..